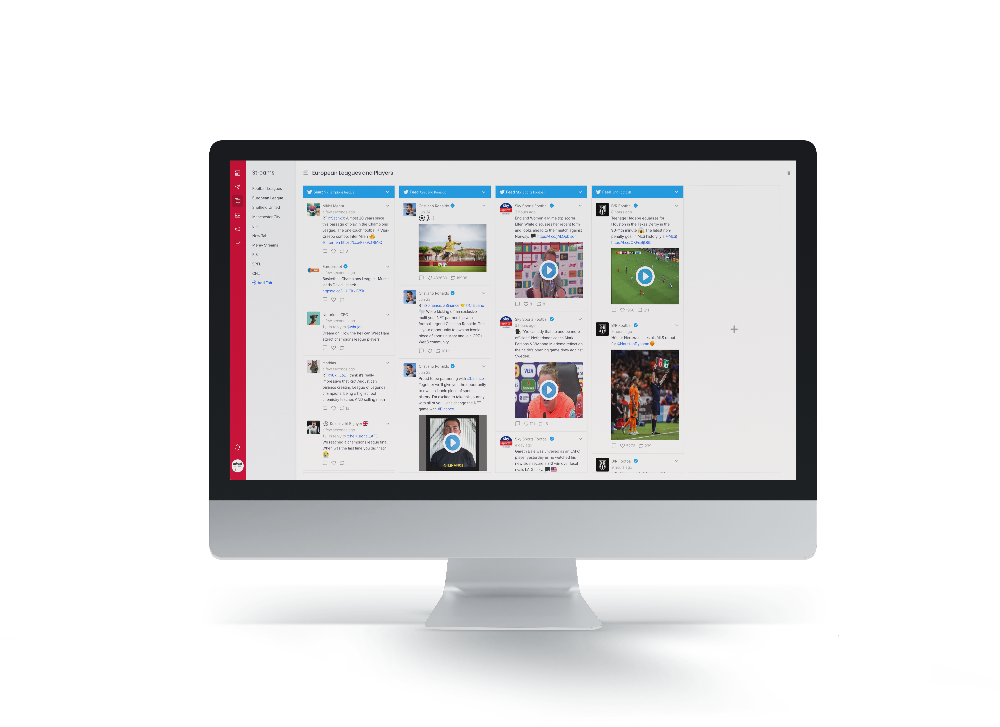
Sports fans of the 21st century crave more and more content, in all its shapes and forms. Meanwhile, capturing fan attention has become a battle, pushing sports entities to become more creative in the stories they tell and the ways in which they tell them. Luckily, sports data has become more widely available in recent years. Data collection methods improved, making data more accessible as well as more diverse. Storytelling data, more specifically, can originate from anywhere: tracking data, performance data, historical data or any other source that can work hand-in-hand with the story you are telling. This provides content producers with fresh outlooks, as there are layers of stories hidden beneath each game, rooted in numbers and data.
The abundance of data, as well as improved data gathering and analysis, allows sports organisations to tell stories fans have never been presented before, in new and exciting ways. These stories draw emotions - from excitement to pride, and awe at the physical capabilities of star athletes - and give fans a chance to experience the games they love in new ways.

These social posts successfully leveraged data to create visually engaging, informative stories for fans.
NBA Analyser: Most 3-pointers in the Playoffs (by a center)
Data Type: Stats Data
About the Content: Visualising the Change in the Game
NBA Analyser’s post showcases the top 3-point shooting centers over the last seven seasons. Up until recent years, centers planted themselves in the paint, capitalizing on high-percentage 2-point shots. That is no longer the case. Nowadays, more and more centers are shooting from behind the arc, and a center who can shoot a 3-pointer has become a true asset in the NBA.
Why It Works: This type of data-driven visual storytelling gives fans a deeper understanding of which centers have come up big for their teams, while creatively displaying the change in the game over the past seven years. Fans are glued to the animation until it is done, which is great for Instagram algorithms.
UEFA EURO2020: Guess That Goal
Data Type: In Game Positional Data
About the Content: Engaging Guessing Game
The UEFA EURO 2020 social pages leveraged historical, positional data to increase engagement in the lead up to this summer’s tournament. Using this information, the EURO 2020 team was able to visually recreate memorable goals from previous tournaments.
Why It Works: By creating a guessing game, EURO 2020 gave their fans a chance to reminisce on previous goals and memories, while also increasing engagement. Fans interacted with the post, posting their guesses and describing each goal in their own words. These comments and interactions give the post the boost it needs to keep coming up on feeds. Creating multiple, similar posts consistently for historical goals also ties back to the necessary consistency expected from social networks.
Bundesliga: Thomas Müller Assist Record
Data Type: Historical Stat
About the Content: Showcasing Thomas Müller’s Ascension to Greatness
This chart by the Bundesliga shows how Thomas Müller’s game improved over time, showcasing the German star’s assists record year-over-year, culminating in two record breaking seasons for the 31-year-old.
Why It Works: Posts such as this one provide fans with a closer look at individuals and their progress over the years, offering them new information about their favourite players and their abilities. This ties into the unique fan-player relationship. Creating this progression graphic connects fans to their idols and shows that it takes time and effort to achieve greatness.
NBA Analyser: NBA Globalization
Data Type: Player Demographics
About the Content: NBA Players Demographic Diversity Over the Years
The NBA has become more and more of a global league with every decade. This carousel by NBA Analyser is key to showing how much the Association has expanded beyond borders, adding talented players from new countries and territories every decade.
Why It Works:
Visualisation of data such as this one is paramount to showing the growth of the world’s top basketball league over four decades, and in turn showcases the increase in global talent. It also appeals to fans globally, giving them the chance to take pride in players who may have hailed from their countries over the years.
NFL Up: Blockies
Data Type: Real Time Positional Data
About the Content: Using Positional Data to Generate Creative Highlights
During the 2020-21 season, the NFL took data-driven storytelling to another level, when partnering with Nickelodeon and Dutch startup Beyond Sports. In a bid to attract younger audiences to watch playoff football, the NFL leveraged Beyond Sports’s data-driven, graphic highlights, to display players as “blockies,” offering full 360 camera angles of actual plays run on the field.
Why It Worked: This offered fans a completely new, entertaining way to watch football that generated chatter across social media. It also allowed the league to connect with a generation who has established viewing preferences different than any other generation before.
Fantasy Premier League: Premium Midfielders Scouting
Data Type: Stats Data
About the content: Using Data to Assist Fantasy Players Make Draft Decisions
Fantasy Premier League uses player statistics from the 2020-21 season to compare different midfielders and therefore help fantasy players make more informed decisions about their teams this upcoming season.
Why it worked: By combining statistics and video, Fantasy Premier League isn’t just telling fantasy players what each midfielder did last season, but showing them proof with a highlight for every player. This not only educates fans, but gets them excited about each player and for the upcoming season. Likewise, it keeps fans engaged with the post for longer, and can even encourage them to continue researching player performance on Premiere League platforms.
Want to learn more about leveraging data collection for improved content and engaging storytelling? Join our upcoming, free webinar, “Data-Driven Content: From Collection to Visual Storytelling.”


.jpg)


